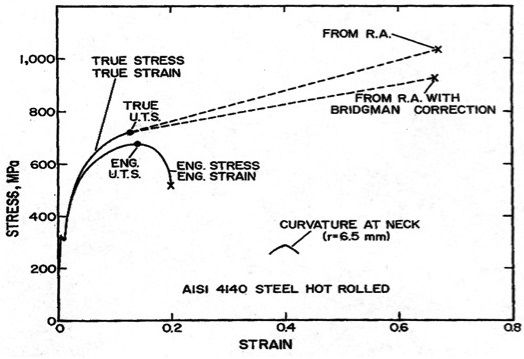
Here's a stress-strain curve with test vs corrected for section reduction true curve.
At around 310-330 MPa, there's a little whoop-de-do along the left side of the chart. That's where the elastic limit is reached and permanent deformation begins. As the test coupon stretches, it necks down in cross section. The lower curve simply shows the test data, without correction for necking. The upper curve is corrected for necking.
You can clearly see on both curves, once it (permanent deformation) begins, tensile strength increases and continues to increase until failure on the corrected curve.
There are are other effects to fatigue and fracture resistance, but the question on the table was strength.
So, as Drew pointed out, if you know the "new" wall thickness and the elongation, you can calculate the new strength of the tube.